

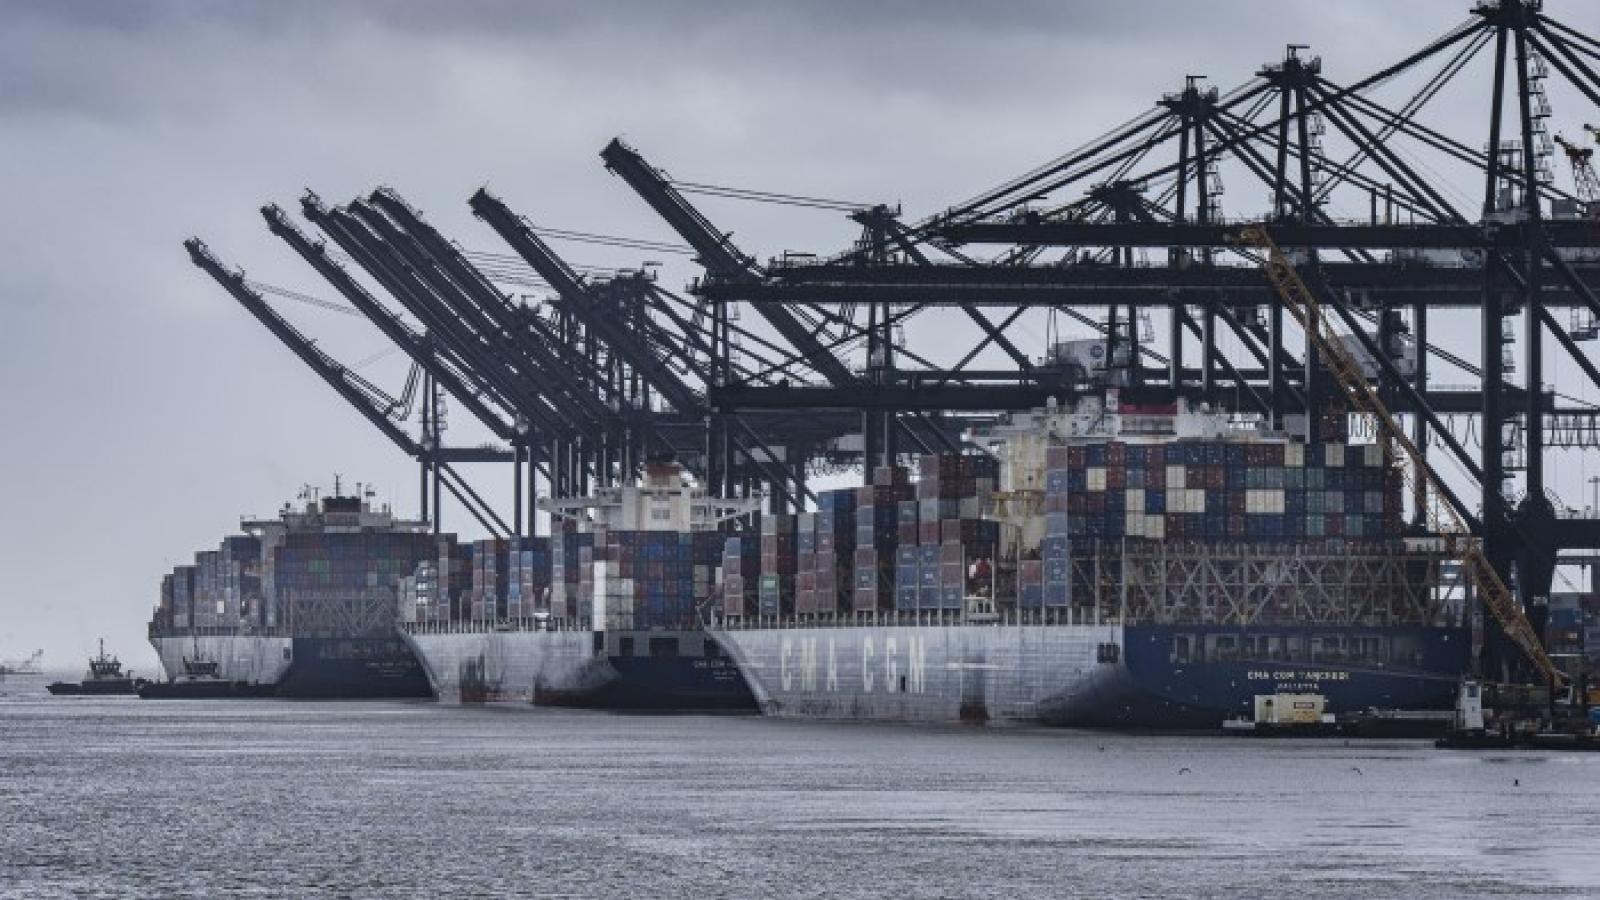
Gulf Coast states such as Texas and Louisiana are not only seeing more energy-related investments, but also more investments in advanced manufacturing. Photo credit: Port of Houston.
Exports of raw materials and intermediate goods, and the import of specialized equipment to produce those goods, are helping US Gulf Coast ports better weather the widespread downturn in container imports compared with those on the West and East coasts. In turn, the manufacturing base surrounding major Gulf Coast gateways is fueling a virtuous cycle of economic and population growth that port officials believe will entice more consumer goods imports.
Total containerized volumes in and out of the Gulf Coast slipped 0.4% year over year to just shy of 2.9 million TEUs in the first eight months of 2023, as a 7.4% drop in imports was offset by a 10.9% increase in exports, according to data from PIERS, a sister product of the Journal of Commerce within S&P Global. By contrast, combined volumes through the West and East coasts fell 15.4% during the same period as imports tumbled 20.2% and exports fell 2.3%.
Through the first half of 2023, Gulf Coast petrochemical manufacturers continued to ride a wave of overseas demand for US-produced plastics that go into a variety of end products such as packaging, paints and construction materials. The return of more consistent vessel service, greater capacity for packaging resins and lower freight rates have also favored resins exporters.
Three broad types of plastic resins — polyethylene, polyurethanes and polyvinyl chloride (PVC) — lead the region’s export growth, accounting for 388,828 TEUs in exports for 2023 and 82% of the growth in outbound containers seen in the first eight months of the year.
Resin exports remain highly sensitive to the world economy, with recent indications pointing to some slowdown in growth. The Federal Reserve Bank of Dallas said in its September business outlook that, according to a survey respondent, “Construction, packaging and industrial demand were proving anemic, and that the weak outlook for China and Europe was weighing on expected export demand” for petrochemicals.
Even so, Port Houston Authority Executive Director Roger Guenther told the Journal of Commerce that any slowdown in resin demand has yet to materialize in the port’s export volumes, which rose 13.8% year-to-date through August, according to PIERS.
“From what I’m hearing, [resins are] going to continue being strong in Houston,” Guenther said. “Anything hydrocarbon related moves through Houston.”
PVC saw the strongest export growth, with outbound volumes of 80,976 TEUs year-to-date through August 2023, up 86% from the comparable 2022 period. Shintech, the world’s largest PVC producer, completed a $1.3 billion expansion of its Plaquemines, Louisiana, plant in 2023 that nearly doubled its PVC output.
Brandy Christian, CEO of the Port of New Orleans, told the Journal of Commerce that after US resins customers restocked their inventories over the past two years, Gulf Coast producers could start focusing more on overseas markets.
“What happened in the last couple of years is domestic plastic resin was strong, so international shipping was kind of flat,” she said. “International shipping has actually started to come back up.”
The expansion of Gulf Coast petrochemical manufacturing, along with the primary oil and natural gas production that supports the industry, also requires imports of valves, fittings and other specialized machinery that go into new production facilities and pipelines. The Dallas Fed’s survey pointed to “robust activity in plant expansions for oil and gas refineries, chemical manufacturers, and low carbon and green energy projects” throughout the region.
Indeed, Gulf Coast imports of machinery, mechanical parts and boilers related to industrial production jumped 8.6% year over year to 140,616 TEUs in the first eight months of 2023.
Manufacturing fueling jobs, imports
Along with expansions in the energy and petrochemicals industry, Houston’s Guenther said the port is also handling more specialized imports related to newer automotive and electronics manufacturing coming to Texas.
Earlier this year, Tesla filed plans for an expansion of its Gigafactory in Austin, Texas, where it has started production of the electric vehicle maker’s new Cybertruck. Samsung is also building a $28 billion chip factory in Tyler, Texas, that should start producing semiconductors in 2024.
“We are seeing more containers with valves and fittings related to manufacturing and industrial production and the import of electric batteries,” Guenther said.
Energy-related projects are also driving increase activity in New Orleans, particularly the development of the Venture Global liquefied natural gas (LNG) project, Christian said, although many of those cargoes are coming into the port as breakbulk, rather than in containers.
However, Louisiana is also starting to receive investments in advanced electric vehicle battery manufacturing that have already taken place in other Southeast US states.
Australia-based mining company Syrah Resources is quadrupling the output of graphite anodes, which are used in electric vehicle batteries, at its plant in Vidalia, Louisiana. The plant will supply anodes to Tesla, LG Energy and SK On, a joint venture between Korea’s SK Innovation and Ford Motor Co.
General Motors is also teaming up with Australian firm Element 25 to build a plant for producing manganese sulfate for batteries to be installed in over 1 million GM electric vehicles annually. Koura Global, which produces a variety of materials for batteries, received a $100 million grant from the US Department of Energy for a lithium processing facility that will also supply material for up to 1 million electric vehicles annually.
Christian said that she expects the various projects, which are being developed between now and 2025, will mean more rare earth metals from sources such as Africa and Australia will be shipped through New Orleans.
The increase in regional manufacturing means more jobs, which in turn should translate to continued strong population growth, further fueling consumer imports from Asia. The Dallas Fed estimates that Texas will see job growth of 2.1% in 2023, faster than the state’s long-term job growth of 2%. In response, major retailers such as Target and Macy’s are expanding their warehousing and distribution footprints in the Houston region, Guenther said.
“Distribution is growing tremendously in and around the port,” Guenther said. “We have a huge population with huge consumer demand, so more cargo from Asia is shifting here.”
Contact Michael Angell at michael.angell@spglobal.com.
| Journal of Commerce Top US Gulf Coast Ports by ImportsContainerized US Gulf Coast Imports, Jan.-Aug. 2023 vs. Jan.-Aug. 2021 and 2022, in laden TEUs |
| 2023 Rank | Port | Jan.-Aug. 2023 Market Share | Jan.-Aug. Volumes202120222023 | Percentage ChangeFrom 2021From 2022 | |||||||
|---|---|---|---|---|---|---|---|---|---|---|---|
| 1 | Houston, Texas | 69.8% | 1,044,496 | 1,271,524 | 1,151,776 | 10.3% | -9.4% | ||||
| 2 | Mobile, Ala. | 10.9% | 165,304 | 183,904 | 180,201 | 9.0% | -2.0% | ||||
| 3 | New Orleans, La. | 4.8% | 86,397 | 79,462 | 78,565 | -9.1% | -1.1% | ||||
| 4 | Tampa, Fla. | 4.5% | 53,486 | 59,666 | 74,276 | 38.9% | 24.5% | ||||
| 5 | Gulfport, Miss. | 3.5% | 56,837 | 65,379 | 58,555 | 3.0% | -10.4% | ||||
| 6 | Manatee, Fla. | 3.3% | 48,506 | 61,679 | 54,783 | 12.9% | -11.2% | ||||
| 7 | Freeport, Texas | 1.8% | 22,375 | 28,390 | 29,101 | 30.1% | 2.5% | ||||
| 8 | Panama City, Fla. | 0.7% | 17,954 | 18,922 | 11,905 | -33.7% | -37.1% | ||||
| 9 | Galveston, Texas | 0.7% | 12,973 | 13,127 | 11,199 | -13.7% | -14.7% | ||||
| TOTAL JOC TOP US GULF EXPORT PORTS | 1,508,328 | 1,782,053 | 1,650,360 | 9.4% | -7.4% | ||||||
| TOTAL ALL US GULF EXPORTS | 1,509,361 | 1,782,673 | 1,650,690 | 9.4% | -7.4% | ||||||
| Source: S&P Global | |||||||||||
| Journal of Commerce Top US Gulf Coast Ports by ExportsContainerized US Gulf Coast exports, Jan.-Aug. 2023 vs. Jan.-Aug. 2021 and 2022, in laden TEUs |
| 2023 Rank | Port | Jan.-Aug. 2023 Market Share | Jan.-Aug. Volumes202120222023 | Percentage ChangeFrom 2021From 2022 | |||||||
|---|---|---|---|---|---|---|---|---|---|---|---|
| 1 | Houston, Texas | 72.3% | 680,976 | 774,781 | 881,509 | 29.4% | 13.8% | ||||
| 2 | New Orleans, La. | 12.7% | 176,853 | 152,487 | 155,105 | -12.3% | 1.7% | ||||
| 3 | Mobile, Ala. | 8.9% | 94,943 | 93,575 | 108,286 | 14.1% | 15.7% | ||||
| 4 | Gulfport, Miss. | 2.6% | 32,543 | 44,155 | 31,163 | -4.2% | -29.4% | ||||
| 5 | Freeport, Texas | 1.1% | 16,829 | 13,188 | 13,577 | -19.3% | 2.9% | ||||
| 6 | Tampa, Fla. | 1.1% | 10,369 | 9,284 | 13,371 | 29.0% | 44.0% | ||||
| 7 | Manatee, Fla. | 0.7% | 656 | 2,944 | 8,103 | 1136.2% | 175.3% | ||||
| 8 | Galveston, Texas | 0.5% | 5,125 | 5,262 | 6,475 | 26.3% | 23.1% | ||||
| 9 | Panama City, Fla. | 0.2% | 4,412 | 4,230 | 2,035 | -53.9% | -51.9% | ||||
| TOTAL JOC TOP US GULF EXPORT PORTS | 1,022,706 | 1,099,905 | 1,219,623 | 19.3% | 10.9% | ||||||
| TOTAL ALL US GULF EXPORTS | 1,022,782 | 1,100,148 | 1,219,666 | 19.2% | 10.9% | ||||||
| Source: S&P Global | |||||||||||
| Journal of Commerce Top 10 Container Carriers by US Gulf Coast ImportsContainerized US Gulf Coast Imports, Jan.-Aug. 2023 vs. Jan.-Aug. 2021 and 2022, in laden TEUs |
| 2023 Rank | Ocean Carrier | Jan.-Aug. 2023 Market Share | Jan.-Aug. Volumes202120222023 | Percentage ChangeFrom 2021From 2022 | |||||||
|---|---|---|---|---|---|---|---|---|---|---|---|
| 1 | A.P. Møller-Maersk* | 19.5% | 311,434 | 330,651 | 321,784 | 3.3% | -2.7% | ||||
| 2 | Mediterranean Shipping Co. | 18.1% | 319,689 | 367,576 | 298,760 | -6.5% | -18.7% | ||||
| 3 | CMA CGM/APL | 13.7% | 267,178 | 243,819 | 226,221 | -15.3% | -7.2% | ||||
| 4 | Cosco Shipping/OOCL | 9.7% | 105,160 | 115,713 | 159,787 | 51.9% | 38.1% | ||||
| 5 | Hapag-Lloyd | 8.9% | 138,015 | 159,535 | 147,435 | 6.8% | -7.6% | ||||
| 6 | Ocean Network Express (ONE) | 5.4% | 44,378 | 101,145 | 88,785 | 100.1% | -12.2% | ||||
| 7 | Evergreen Line | 4.8% | 46,256 | 73,458 | 79,542 | 72.0% | 8.3% | ||||
| 8 | Zim Integrated Shipping Services | 4.8% | 58,903 | 59,516 | 78,797 | 33.8% | 32.4% | ||||
| 9 | Dole/Tropical Fruit Americas | 3.3% | 43,098 | 53,842 | 55,275 | 28.3% | 2.7% | ||||
| 10 | Del Monte | 2.1% | 32,432 | 37,857 | 34,773 | 7.2% | -8.1% | ||||
| TOTAL JOC TOP 10 US GULF IMPORT CARRIERS | 1,366,544 | 1,543,112 | 1,491,159 | 9.1% | -3.4% | ||||||
| TOTAL US GULF IMPORTS | 1,509,361 | 1,782,673 | 1,650,690 | 9.4% | -7.4% | ||||||
| *A.P. Møller-Maersk includes Maersk Line, Sealand, Safmarine and Hamburg Süd. | |||||||||||
| Source: S&P Global | |||||||||||
| Journal of Commerce Top 10 Container Carriers by US Gulf Coast ExportsContainerized US Gulf Coast Exports, Jan.-Aug. 2023 vs. Jan.-Aug. 2021 and 2022, in laden TEUs |
| 2023 Rank | Ocean Carrier | Jan.-Aug. 2023 Market Share | Jan.-Aug. Volumes202120222023 | Percentage ChangeFrom 2021From 2022 | |||||||
|---|---|---|---|---|---|---|---|---|---|---|---|
| 1 | A.P. Møller-Maersk* | 22.8% | 235,953 | 256,757 | 278,560 | 18.1% | 8.5% | ||||
| 2 | Mediterranean Shipping Co. | 21.6% | 184,081 | 237,828 | 263,568 | 43.2% | 10.8% | ||||
| 3 | CMA CGM/APL | 16.4% | 196,904 | 162,490 | 199,539 | 1.3% | 22.8% | ||||
| 4 | Hapag-Lloyd | 10.8% | 144,621 | 140,295 | 131,441 | -9.1% | -6.3% | ||||
| 5 | Cosco Shipping/OOCL | 7.3% | 63,282 | 64,489 | 89,583 | 41.6% | 38.9% | ||||
| 6 | Ocean Network Express (ONE) | 4.3% | 19,576 | 42,015 | 52,860 | 170.0% | 25.8% | ||||
| 7 | Zim Integrated Shipping Services | 3.3% | 26,016 | 17,692 | 40,120 | 54.2% | 126.8% | ||||
| 8 | Seaboard Marine | 2.7% | 46,597 | 47,282 | 33,511 | -28.1% | -29.1% | ||||
| 9 | Evergreen Line | 2.5% | 33,233 | 22,091 | 30,443 | -8.4% | 37.8% | ||||
| 10 | Dole/Tropical Fruit Americas | 1.5% | 16,914 | 22,564 | 18,015 | 6.5% | -20.2% | ||||
| TOTAL JOC TOP 10 US GULF EXPORT CARRIERS | 967,177 | 1,013,505 | 1,137,641 | 17.6% | 12.2% | ||||||
| TOTAL US GULF EXPORTS | 1,022,782 | 1,100,148 | 1,219,666 | 19.2% | 10.9% | ||||||
| *A.P. Møller-Maersk includes Maersk Line, Sealand, Safmarine and Hamburg Süd. | |||||||||||
| Source: S&P Global | |||||||||||